


Introduction
The NHS waiting lists stood at 7.2 million people in the latest official figures from November 2022. The good news was that waiting lists reduced slightly for the first time since the pandemic. It may be a false dawn, but worth noting.
Since waiting lists will be a major factor in the next election, Prime Minister Rishi Sunak has pledged to reduce them by the end of 2024, even while Secretary of State Steve Barclay is currently facing challenges from ongoing strikes and conflict with unions over the wage bill. This article will delve into the reasons for the NHS’s inability to reach pre-pandemic treatment levels, assess the accuracy of previous predictions and explore the possibility of bringing down waiting lists.
The NHS elective recovery plan, announced in February 2022, aims for FY25 elective activity to be 30% above FY20. This is a higher growth rate than NHS has achieved in the past. As has been widely reported, the NHS system is still treating fewer patients post-pandemic despite having materially more staff and money, as shown in Exhibit 1.
Most coverage, including well-known think-tanks, accepts that the major factor has been reduced bed capacity. Internationally and for UK private hospitals, Mansfield Advisors would normally look first operating theatre capacity, and then perhaps high acuity ward (i.e. recovery) capacity, to truly understand the constraints on operational performance. Operating theatres require capex and time, so corporate hospitals normally understand their utilisation and therefore return on capital fairly well. General ward capacity is not normally the first concern for elective patients, rather than urgent or medical patients. Of course, bed capacity is a slightly more slippery concept than it first appears, since internationally actual capacity is practically based on staff numbers, often with patient ratios defined by regulation rather than physical beds. However for space-constrained British hospitals, with staff:patient ratios close to minimum levels already, bed capacity is actually pretty close to true capacity so we can use the data with an intellectually clear conscience.
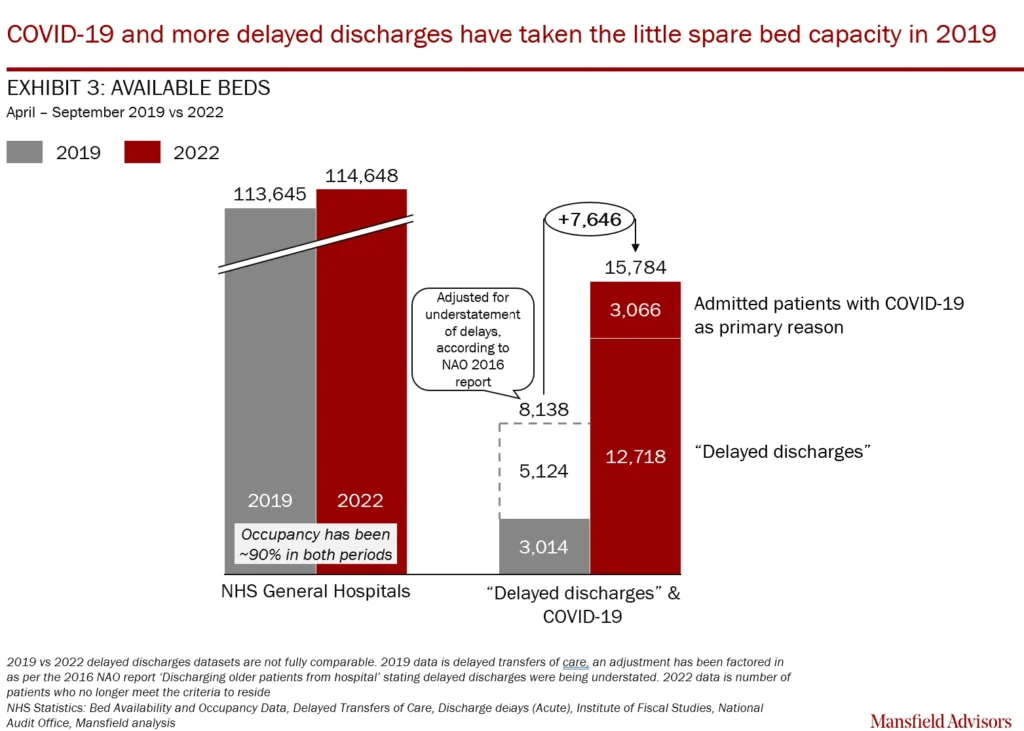
An unusually high number of beds are indeed currently being taken up by delayed discharges and COVID-19 patients. The sickest COVID-19 patients will not be on ventilators and highest acuity intensive care beds, but the sickest may well absorb the high acuity recovery beds, since they need assistance with their breathing and nurse attention. Much elective surgery cannot start if there is not a guaranteed bed for the post-operative recovery. The NHS’s January 2023 announcement of £1B for 5,000 extra beds (~5% capacity increase) and 800 new ambulances by next winter reflects their acknowledgment of the impact.
Activity is still yet to reach 2019 levels
The NHS is treating substantially fewer patients in major care types, such as outpatient appointments and elective admissions, compared to 2019. This is even more surprising when you also consider relentless demographic pressure. However, there has been 6% more activity in the latter half of 2022, albeit partly because of more NHS-paid activity in private hospitals. There has also been recently a material increase in first cancer appointments, required within two weeks, but still lower than pre-pandemic levels. In primary care, GP appointments increased 4% on the back of more teleconsultations, despite a shortage of GPs, but in November 2022 nearly 1.4 million patients still waited a full month for an appointment.

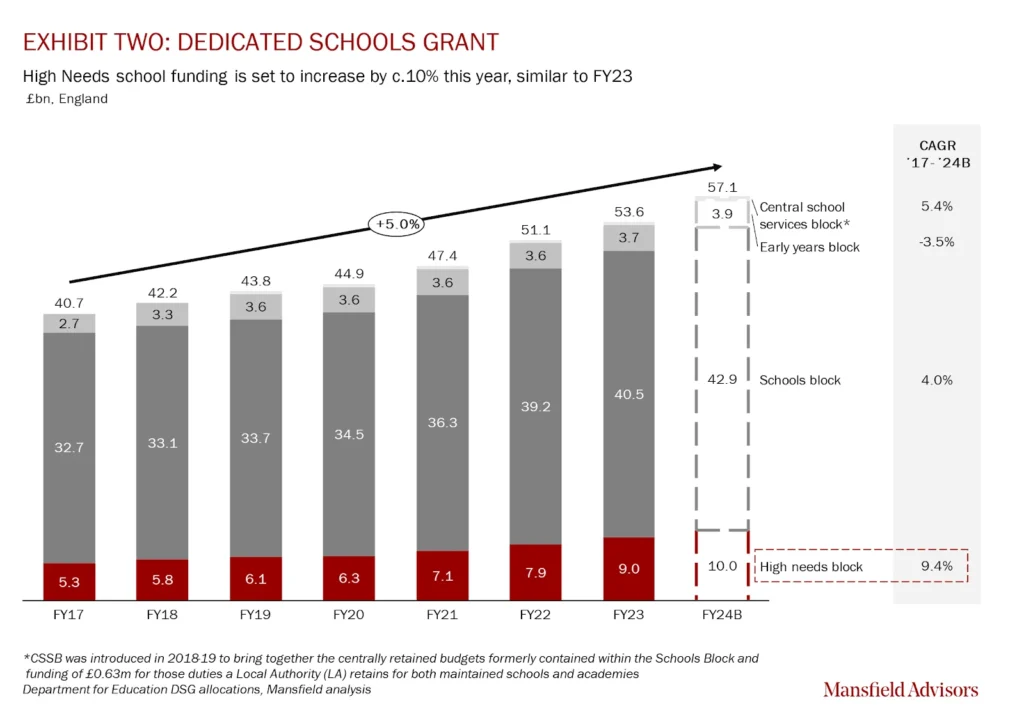
Funding for both the public and independent sectors is through local authorities and is secure. Pupils and students with significant Special Educational Needs and Disabilities (SEND) support, aged 0 to 25, are funded through the high needs budget within the Dedicated Schools Grant (DSG). Introduced in 2013/14 before the 2014 SEND reforms, the high needs budget is not ring-fenced giving local authorities discretion to spend within or beyond budget limits to meet their SEND statutory duties; there is typically an overspend. The DSG covers funding for both mainstream and non-mainstream education settings, with the High Needs Block being the major source of funding for students with EHCPs.
The NHS has more staff and money than in 2019
NHS England estimated that 2021 productivity was 16% lower owing to infection control measures and higher sickness. Staff absence rates have risen 4.2% to 6.1%, arguably since staff suffered both burnout and the subsequent resurgence of respiratory illnesses. There has been a larger increase in staff from 2019 than most people realise: 17% more junior doctors, 11% more hospital nurses, and 10% more consultants, please see Exhibit 1.
There is anecdotal evidence of less appetite for extra shifts from nurses and overtime for doctors, but not enough to offset full-time equivalent employment. There is also much argument that the treatment mix has changed, with patients more acute than three years ago, partly as a result of the delays in treatment. This is difficult to quantify, even in the data-rich NHS system, without dedicated research which is not yet available.
Nurses have been striking and the Royal College of Nursing (RCN) is demanding a 19% pay increase. Ambulance paramedics and physiotherapists have joined them. The British Medical Association (BMA) has opened a ballot for junior doctors, which runs until February 20th.
There are 1.9% fewer GPs compared to 2019, so the supply/demand mismatch has worsened in primary care. The Government has committed to publishing “independently verified forecasts” of the number of nurses and other staff the NHS needs as part of a long-term workforce plan, but the publication date has slipped already.
The Chancellor recently announced additional funding of £3.3B for the NHS in FY24 and FY25, following multiple funding increases over the past several years. According to pre-pandemic plans, FY23 spending was budgeted at 16% higher than FY19, but it will actually be 23% higher as pandemic spending has not fully subsided. Total spending for FY25 should be ~£165B.
The sense of crisis has not dissipated
The additional staff may not be addressing the constraints in the system on surgical procedures, since critical care and high dependency beds require both specific training and experience, and additional plant and equipment. Simultaneously, the closer to capacity the rest of the hospital is, when most wards are already run at low staffing levels, the less likely staff are to be redirected and the necessary capex found. We can see in bed utilisation data that hospitals are normally at 90% of capacity.
Too much of the work in a hospital is created by patients who – on clinical terms alone – could and probably should for their own benefit be somewhere else, further along in their care pathway. The pejorative term for these patients is ‘bed-blockers’ and it’s often found in newspaper headlines. Of course, not all such delays are feasible to avoid and the scale of actual inefficiency depends on who is doing the reporting and analysis.
All agree that the hospitals and other parts of NHS organisations themselves comprise the largest part of the sources for these inefficiencies. The National Audit Office (NAO) even suggested in 2016 – based on its own primary data – that the actual number of ‘bed-blockers’ was 2.7x that reported by the NHS hospitals themselves, with the understated implication that a clear majority owe their apparent delay to internal NHS factors. Notwithstanding that one finding, NHS hospitals’ own data would suggest that nearly half (46%) of available bed-days lost to delays in 2019 were owing to social care factors. (See Exhibit 2)
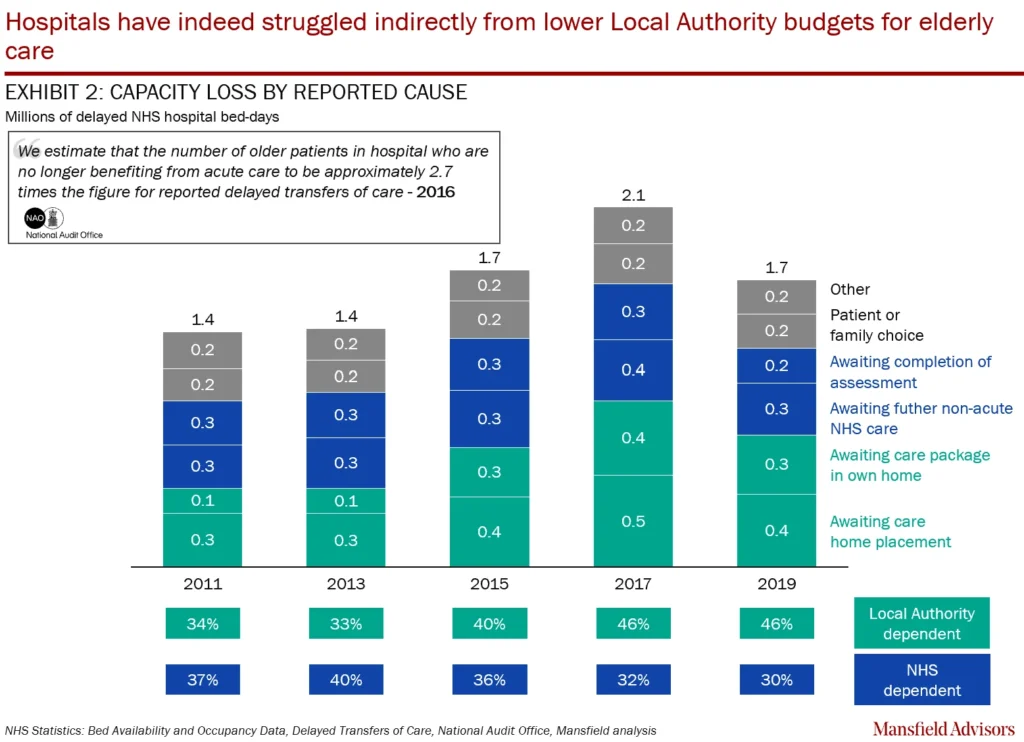
There are always such problems in moving patients onwards, arising from social care’s reliance on Local Authorities’ elderly care budgets and, indirectly, from patients’ families having to both pay, arrange and accept long-term care arrangements. These social care issues rose steadily in the last decade after the 2011 Spending Review caused Local Authorities to restrain their elderly care budgets. The NHS hospitals’ reported bed-days lost to social care issues rose to a peak in 2017 (see Exhibit 3), and this growth was widely publicised and criticised.
The losses in available bed-capacity from social care issues did peak around 2017, with increased spending of £2B budgeted directly towards social care spending by the Government. The problem since then is not possible to show since the full dataset after COVID-19 has not yet been published. It is certainly true that there is chronic undersupply of intermediate or sub-acute care, including all three Rs of rehabilitation, reablement and recovery. Often there is simply a lack of care workers in some areas. Skills for Care reported the English adult social care workforce even shrank in FY22, for the first time in nine years, so the situation may have deteriorated somewhat.
One thing that has certainly changed since FY19 is that 3,000 beds contain COVID-19 patients (see Exhibit 3), not even counting influenza and other respiratory conditions which are both seasonal and vary a lot from year-to-year. Patients arrive sick and then acquire something different, which may not be serious in itself but is material when patients are older and more vulnerable. We believe that much of the problem is owing to a lack of capital spending over many decades, with multi-bedded wards instead of single patient bedrooms a major reason for hospital-acquired illnesses. Compare that with infrastructural decisions in France, where single rooms became the norm a long time ago. Relative spending on healthcare in the U.K. is now comparable to its peers, but capital investment is still lower and there is presumably lower return to spending owing to high land and construction costs.
Bed capacity issues would also not explain post pandemic decrease in either outpatient appointments or non-admitted treatments.
Some of the waiting list projections have been accurate when misplaced assumptions cancelled; we see a possible peak mid-to-late 2023
In February 2022, the Institute for Fiscal Studies (IFS) projected NHS waiting lists with four scenarios. (See Exhibit 4) The base scenario assumed that the NHS would achieve its goal of increasing elective activity by 30% by FY25 (compared to FY20), and that half of the patients who would have joined the waiting list during the pandemic would return to seek treatment. An alternative low scenario was also considered, where the same assumption was made about NHS activity levels, but it was assumed that only 30% of the ‘missing’ patients would return. The NAO also modelled two scenarios in late 2021, both assuming that 50% of the ‘missing’ referrals would return, but with different levels of NHS activity increase. The first scenario assumed a 3% increase per year (~17% to FY25) in line with the Long Term Plan, while the second scenario assumed the NHS would meet its COVID recovery plan of increasing activity by 30% in FY25 – similar to both IFS models. To put this in context, before the pandemic, it took the NHS five years (FY14-FY19) to increase completed elective pathways by 18%.
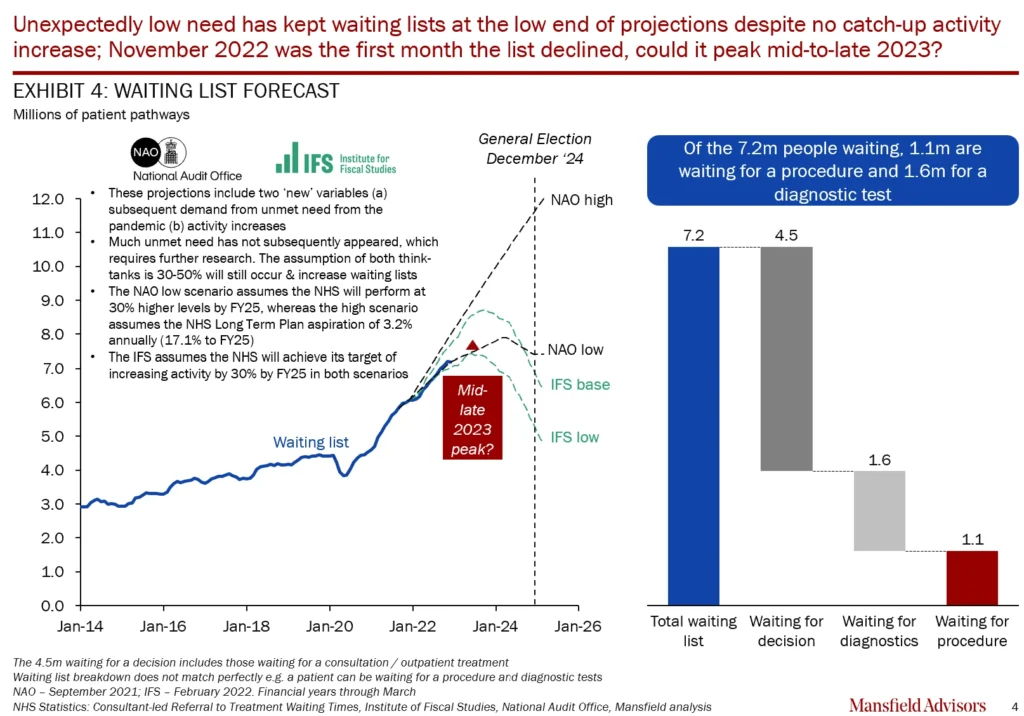
There are early signs of some improvements in recent months, probably as more realistic central targets and financial incentives have stimulated some steady, if slow, activity increases in NHS hospitals. But they are still some way off these earlier targets. Yet the waiting list actuals are tracking the low projections, because a high proportion of the pandemic’s unmet need has subsequently failed to materialise. At first glance this is good for the hospitals (and politicians) but raises serious questions that require research. No one factor may predominate, but we note there has been a concerning rise in excess (higher than expected) deaths from multiple causes since the pandemic, which seems to be occurring in many comparable countries and may owe something to a lack of treatment through that two year period. More prosaically, some issues will have resolved themselves without treatment, as many aches and pains do, without a consultation from a specialist. Other patients will have died no matter what, and other go to private hospitals and we can see the latter in public company results.
We don’t see any reason for another surge in the waiting list totals. Mansfield Advisors expect the waiting lists to continue to follow the low scenarios, peaking in mid-to-late 2023. Activity will be higher but will not achieve the stated targets.
Only 1.1 million of the 7.2 million on lists are awaiting a procedure, though this is 300,000 higher than pre-pandemic. 1.6 million await diagnostics, presumably imaging, and the remaining 4.5 million have a date for a consultation and/or decision. There are overlaps between these lists.
If we consider purely the political implications for the moment, which are likely to result in action, we think the number awaiting a procedure is more sensitive in the short term. We will consider the diagnostic waiting lists more in next month’s article in this very magazine, but spoiler alert – we simply don’t think there are enough staff and especially radiologists to make a substantial dent in waiting lists, even if there is more equipment and available spending on the teleradiology segment. Understanding those waiting for a consultation, the underlying factors and impact on patients would require a thorough analysis by speciality and/or disease condition and probably warrants an article in itself.
In principle, a national initiative using private hospitals could get waiting lists quickly down to pre-pandemic levels, if not eliminate them completely without complete system change
Back to those awaiting a procedure, and the heart of most of our readers’ interest in this article, is whether there will be more use of the private hospitals. The NHS has already a goal to increase “independent sector provision” by 20% above pre-pandemic levels by March 2023, equivalent to 9% of elective procedures. There has indeed been a 140% volume increase in ophthalmology and 5% in orthopaedics, from 2022 vs 2019 (last three months to November only.)
Yet other specialties – general surgery, gastroenterology and urology – decreased 11-30%! Integrated Care Systems (ICSs) / Boards (ICBs) are less keen to spend on private hospitals than central policy would theoretically support. The NAO has even found examples where a referral to a private hospital would result in a standard elective tariff payable from the local ICS’s budget, but it would be a cost to them and not revenue neutral, since there is no central reimbursement without other, higher targets being met. This type of disincentive helps explain why local systems can sometimes obfuscate or delay patients’ free choice of first consultation provider.
Private hospitals and clinics would of course prefer to have predictable minimum volume contracts, which support planning and financing, but they can function effectively as long as there are consistent volumes. We are told that many local commissioners or hospitals have been put off making such medium term arrangements because their own budget conditions are uncertain.
But another question is how much do private hospitals really want relatively low-priced NHS activity when private demand is currently strong?
Spire Healthcare reported a ~2x increase in self-pay revenue in H1 2022 to H1 2019. However, a survey of executives in private hospitals found that many still see NHS-paid activity as key for growth. We understand that earlier tentative Government discussions for a national elective surgery catch-up initiative floundered only when they were looking for a further discount on the national tariff, even after the local “market forces factor” price supplement that NHS hospitals receive and private hospitals do not typically. But though private healthcare providers such as Spire Healthcare have specifically said they focus on private pay, we still wouldn’t expect most of their hospitals to turn away NHS referrals in reasonably cost-effective volumes and at standard NHS tariffs.
Waiting lists should be a major issue in the next General Election, which we expect by autumn 2024, unless they are unequivocally declining by that point. Our latest top-down analysis suggests that the private hospitals would have to do only another 100,000 procedures in total to help stabilise waiting lists, and another 200,000 would return waiting lists to pre-pandemic levels by the end of 2024. We wonder if the Government is fully aware that the waiting list for procedures, if not diagnostics etc, is more tractable in this way. We have not arrived at these numbers only by what is needed politically, but also what we feel the private hospitals could reasonably do without substantially altering their operating model or long-term value proposition. If the Government wished to achieve this, it would be surprisingly affordable, but would require a ‘National Treatment Fund’ of at least £800m to avoid the budgetary issues which subvert the full use of Patient Choice by individuals and their GPs. Please see Exhibit 5.

(Please bear in mind that there are public companies in the sector and that the author(s) or their colleagues may have shares in such companies, or smaller private clinics, personally or in their pensions.)
Our reasoning is that in 2019 private hospitals performed 1.1 million procedures and 40% were NHS-paid. Private operating theatres have traditionally low utilisation rates of 50-55%, with spare capacity at odd times which are less convenient for surgeons. Another 150,000 annual NHS procedures over two years, on top of the additional growth in private would only increase utilisation towards 70%, allowing for some private growth at the same time. The most immediate challenge might be the availability of surgeons, who are contracted to local NHS hospitals. We admit this is a simple analysis and there are challenges, but broadly there is much that could be done. The private hospitals may indeed benefit disproportionately from less complex cases etc, but we would see these higher efficiencies as a feature and not a bug.
Of course, any such fund would have to be available equally to NHS hospitals, if they were able to expand the use of their facilities and staff beyond normal operating hours, possibly with the help of insourcing management companies.
In conclusion, we do acknowledge the progress the NHS has made in recent months with higher activity levels. However, there is a long way to go to achieve even pre-pandemic performance, and the “politically acceptable” waiting times of a decade ago are still further away from being achieved. The private hospitals would have to play a major role in regaining those, as they did under the Labour Government of the noughties. It may be that by the time of the next Labour Government, the modern public’s patience and comfort with the British phenomenon of millions of patients sitting on waiting lists will be finally exhausted and alternative approaches will be seriously considered.


