The greatest of British queues now seems to have already reached its longest point. We are now over the hump for those infamous waiting list totals, even if we don’t expect much of a decline until later this year.
In this follow-up article to February 2023, which may well become a long-running series, Adam Scott, Senior Partner, Ali Bahram, Engagement Manager and Filippos Papadopoulos, Analyst at Mansfield Advisors explore public data on what has actually transpired since it seemed that official waiting lists might experience a deluge of unmet need. As before, we are specifically interested in waiting lists for specialist attention and hospital treatment, rather than GPs and NHS dentists.
NHS waiting lists were growing at unprecedented rates as a result of the pandemic and associated policies, when we noted some encouraging signs in our earlier article and suggested the peak was in sight. This is now further supported by the data, which show the first consistent declines in patients waiting to see a specialist and record levels of NHS activity.
However, this apparent turnaround is not yet reflected in public perception, which hit record lows in a recent British Social Attitudes survey. Only one in four reported personal satisfaction with the NHS in 2023 versus more than one in two in 2019. Patients care about whether they, or a family member, are waiting – not whether the totals have reached a peak.
It certainly doesn’t help that the true number of people waiting for hospital specialist attention or diagnostics may be 50% higher at 9.7 million people compared to official totals of 6.3 million. The Office for National Statistics surveyed over 100,000 people – which is an impressively large number – and their analysis argues that this is the true total who believe themselves to be waiting for some activity from a hospital or clinic. The difference may largely lie in people waiting for follow-up appointments, who would not show up in official figures because they have already seen a specialist and are officially not waiting for their treatment to start.
As a patient, if I am waiting to see if my prescription does the job, it is obviously not the same as waiting for a follow-up dermatology appointment scheduled for a date sometime next year, or an MRI scan in six weeks. So, some of the follow-up delay is clinically justified, but not all of it, and since this is difficult to measure, the focus is on the waiting time to first consultation, scan or procedure. Of course, public patients experience much more waiting than commonly acknowledged by providers, including for unconcerning test results or consultations prompted by symptoms which are not red flags.
Putting these considerations aside, let’s look at the factors influencing the headline figure that you’ll be reading about through and long after 2024’s general election. Spoiler alert: despite private and NHS activity both increasing, there’ll need to be even more NHS spending in private hospitals if the waiting lists for elective procedures are to return to the 2019 level before the end of the next Government’s term in office.
There was a widespread concern that a flood of delayed treatment would further overwhelm waiting lists.
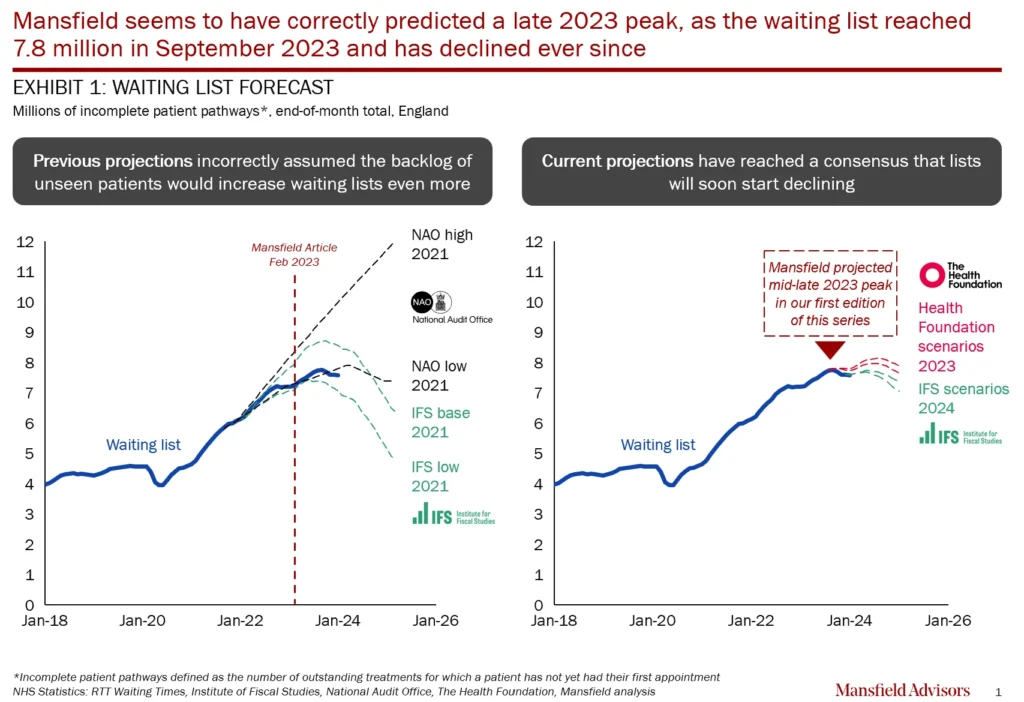
We correctly predicted a mid-late 2023 peak in our February 2023 article. The waiting lists peaked soon after in September 2023 at 7.8 million ‘incomplete pathways.’ A patient pathway is counted as ‘incomplete’ and so part of the waiting lists, if the referring doctor – either a GP or specialist – has made a referral but the requested appointment, scan or procedure hasn’t yet happened. Since the peak, there has been a steady – albeit modest – decline of almost 200,000 to January 2024. A reduction to pre-pandemic levels will take more than six years at the current monthly decline rate of only 0.6%.
Prime Minister Rishi Sunak recently admitted defeat in delivering his promise to cut the waiting list quicker. The polls suggest a Labour Government may soon be able to implement their ambition to ‘get the NHS back on its feet’ by delivering an additional two million elective procedures annually, in evenings and on weekends. Their strategy hasn’t been much more specific than “more work on evenings and weekends”. Though the likely next Secretary of State for Health, Wes Streeting, has been explicit about Labour’s intention to “partner with the independent sector.”
Most earlier scenarios from the Institute for Fiscal Studies (IFS) and the National Audit Office (NAO) gave a pessimistic outlook. They expected a significant proportion of ‘missing patients’ – those never seen during lockdown – to subsequently seek treatment. Since nothing like the pandemic had ever occurred before, this seems sensible at first glance.
Somewhat less realistic were their scenarios that NHS providers might actually complete more elective procedures, based on the central target for 2024/25 target of 30% greater activity than pre-pandemic. As we noted in February 2023, this would be far more than growth achieved in the five years from FY14 – FY19 of 18%.
The more recent projections approach a consensus that the total will stabilise and then moderately decline before the next general election. Though not quickly: even the IFS’s most optimistic scenario has the total still higher than pre-pandemic at 5.2 million by the end of 2027.
Our Mansfield view is that the decline could and should be faster. Our argument is that Labour should and will be less hesitant to direct both more private delivery and a return to targets. Our optimism relies on a new Government keen to start measuring output against targets and appetite for more of the Noughties-style top-down direction and deployment of managerial resources. Targets are always more attractive when there’s a bad starting point and every expectation of improvement.
Millions of patients were never referred but did not appear later.
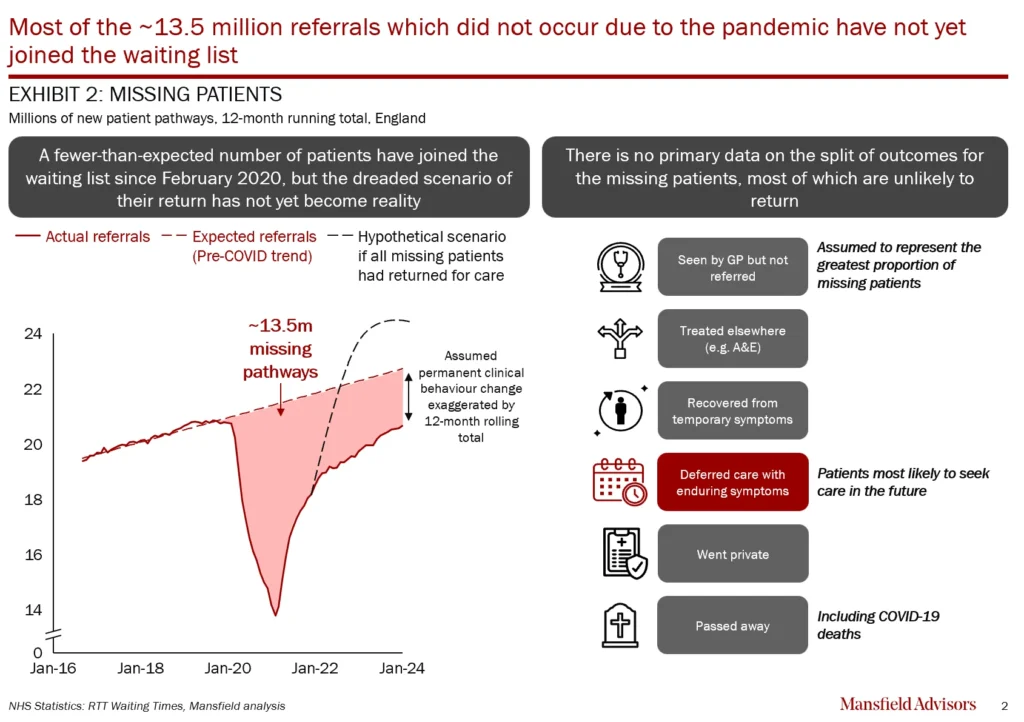
Around 13.5 million more patient pathways would have been created between FY20 and FY24 if referrals had continued growing 1.9% annually, but the pandemic intervened. Most onlookers assumed that many of these patients would present later, but it’s now apparent that the vast majority will never do so.
[A typical patient is roughly equivalent to 1.3 pathways which are created with each referral, since one person can be waiting for multiple treatments.]
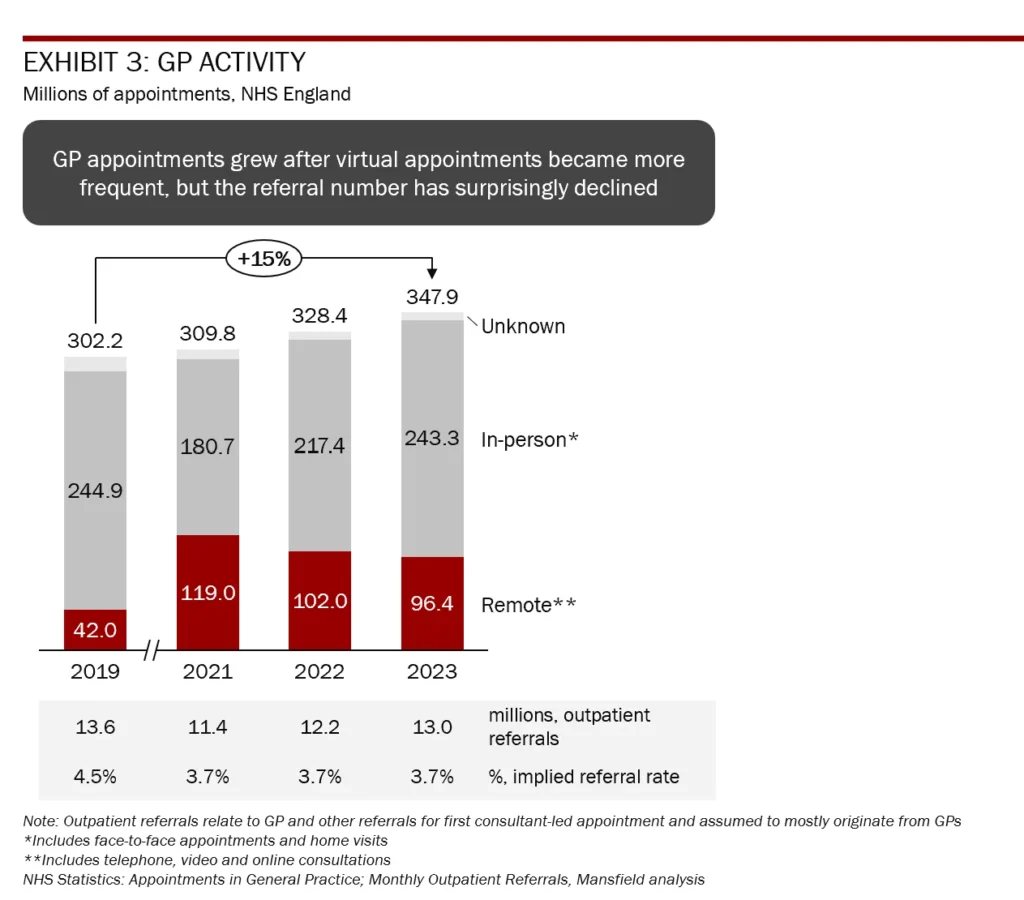
Mansfield believe GPs have made ~9 million fewer referrals over the past four years through FY21 to FY24 – assuming the pre-pandemic outpatient referral rate of ~4.5% was maintained instead of the current average of ~3.7% – but without obvious consequences for those patients subsequently. We can’t fully evidence this without a material budget for interviewing and surveying GPs, but we believe the single largest category was GPs refraining from referring patients who were high-risk during the pandemic. 18.5 million people would have been in this category, and not all were elderly but included those with serious respiratory conditions for example.
We believe it was GPs who made the difference over this period, rather than individuals not seeking nor being able to access them, because the total number of GP appointments did not fall but rose by 15% in 2023 compared to 2019. GP appointments dropped in 2020 but by 2021 had more than rebounded.
GP referrals are still slightly lower in 2023 (20.6m) versus 2019 (20.8m). We surmise that there is some more efficient patient handling, with referrals perhaps avoided by more direct communication and discussion between GPs and specialists.
This still does not explain the 4.5 million difference between 13.5 million and the 9 million pathways we ascribe to altered referral behaviour over the pandemic itself. Let’s explore our reasoning in more detail.
These patients (with their missing pathways) are today either (1) healthy, having recovered or been treated elsewhere (e.g. A&E) (2) are unknowingly getting worse since a chance detection of their condition did not occur, (3) have gone private or (4) have passed away, either from an undetected condition, or from the excess deaths directly owing to the pandemic.
1) If the patients are healthy, there is no reason for them to join the waiting lists now. Their symptoms of personal concern cleared up. Had they been more accessible, a GP might have referred them and an ultimately unnecessary consultation or diagnostic scan has been avoided. The initial GP appointment may have been ‘too sensitive’ and incurred unnecessary activity what, which in a diagnostic test would be called a ‘false positive.’
2) If they are unknowingly getting worse, they will present with a far more progressed illness in due course. They didn’t present at A&E or a GP and there was no early detection. Remember about a fifth of all cancers are discovered in patients who were originally on the waiting list for something else. Now, if cancer, the patient is more likely to present at an advanced stage in A&E and the possibility of a successful treatment has been missed. They will never even be on the ‘two-week wait’ list for cancer.
Cancers can take a surprisingly varied time to develop or indeed not progress at all – but to cut through hundreds of academic papers at once – we expect most unfortunate people in this thankfully small category to progress over two to four years. Tragically, many will already be part of the ‘excess deaths’ total below.
Less serious conditions had people recover or self-manage, just as the textbooks remind us that most healthcare management for chronic conditions is by patients themselves. If no concern is raised and referral made, they may not be healthy but they don’t get any worse. Probably they are the same older individuals who are referred later, but not twice for the same long-term, underlying problems.
3) Those who went private are most likely self-payers as if they had private medical insurance, they wouldn’t be on the waiting list at all. The UK, outside of Northern Ireland, does not have waiting lists for private consultations. The increase in self-payers was about 190,000 procedures over this period, not including diagnostic scans. We roughly estimate the total number of pathways that went private instead of being referred on an NHS waiting list to be ~1 million (assuming a four-to-one ratio of outpatient to inpatient activity as performed in the NHS).
4) It might seem unsurprising if many have simply died of old age since a very high share of all healthcare cost is incurred in the last 12 months of life. However, the classic frail individual going in and out of hospital would most likely receive acute medical treatment and fewer surgeries, they are not the typical 70-year-old waiting for elective orthopaedic surgery. If they died from an untreated condition – say a heart condition – they should be in any recent excess deaths data. There were 170,000 ‘excess deaths’ (i.e. more than would have been expected pre-pandemic) over the four years. This puts an upper bound on this category.
Normally, around ~3.6 million pathways annually are never completed because patients presumably recover, go private or pass away. This dropped to ~2.4 million post-pandemic. The annual difference of ~1.2 million who never made it on the waiting list can potentially be attributed to marginal cases that were not referred by GPs, patients with mild symptoms who opted to self-manage and those who decided to self-pay without ever seeking NHS attention first. That would total around 5 million pathways over the four years.
A short digression into why we have to estimate this rather than report real-time findings.
If public hospitals had to sell to their patients, and eagerly sought out the work and its accompanying revenue, there’d a strategic marketing function which would have segmented the customers and understood what therapeutic value was being created where, what the substitute and competitive provision was doing, what needed to be communicated to payors so pricing could be set optimally. As part of this, they would now know what had happened to patients who hadn’t appeared, since referrers are their customers.
None of their figures would be necessarily precise, but they would be ‘directionally correct.’
In actual practice, public hospitals’ only customer is the Government, via the various bureaucracies. Hospital executives are mostly concerned with its priorities and not being an obvious outlier in any failure to deliver. Notwithstanding minor complexities of the private patient units and the remaining remnants of “internal market” reforms, NHS providers have no individual incentive, and considerable data handling problems, in obtaining an understanding of their patient population and operational forecasts.
Remember, waiting lists are not a problem for providers, either here in the UK, the Republic of Ireland or any other country where they exist. Public waiting lists are only a problem for patients and politicians, and they occur because healthcare capacity has been constrained through state policy to lower the total cost to society.
NHS hospitals are doing more of everything but operations.
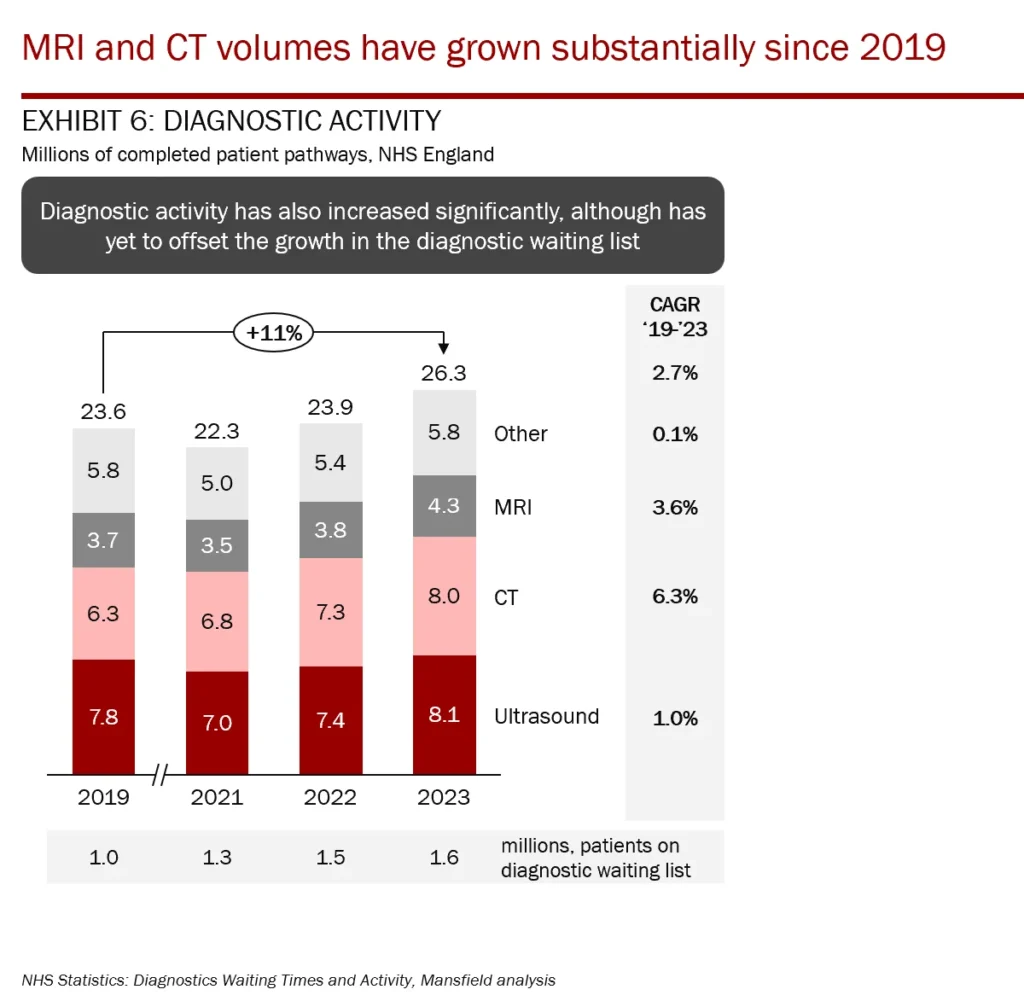
The whole NHS now has more budget, consultants and staff, than ever before. GPs have delivered 15% more appointments and diagnostic scans are 11% higher than 2019. GPs are referring patients less frequently, even when allowing for a shift in mix towards virtual appointments.
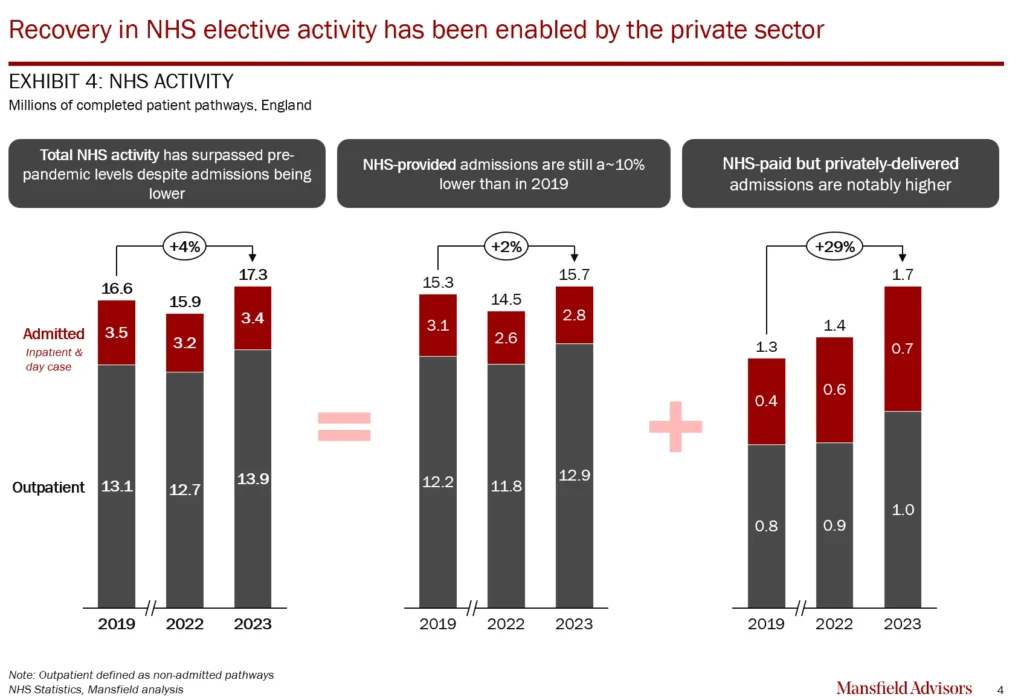
Public and private providers delivered 17.3 million NHS-funded treatments in 2023, about 700,000 more than 2019. This 4% increase in output was also helped by ~4% fewer outpatient referrals. The original recovery plan for 30% more elective activity in 2025 (i.e. 21 million total procedures) was obviously unrealistic and recent plans are far more modest. These would – by simple arithmetic – result in a very slow decline in waiting lists.
The increased output gains versus 2019 were only achieved in consultations and diagnostics, not inpatient/day-case procedures. The new ‘community diagnostic centres’ built since 2021 and responsible for only ~9% of activity in February 2024, were not the main cause. We wrote about constrained diagnostic capacity – shortly after waiting lists – in March 2023.
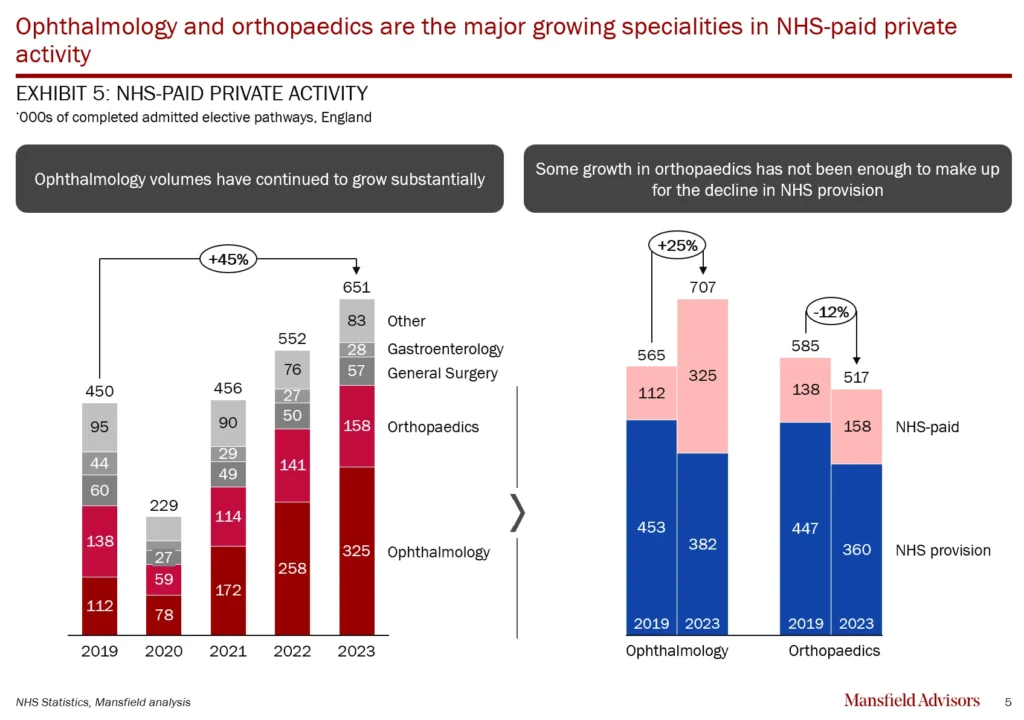
Half the increased output for 2023 came from more NHS-paid work done privately, as the NHS paid for 45% more inpatient and 20% more outpatient activity than 2019. By contrast, 2023 admissions to NHS providers were still 10% lower than 2019, with orthopaedic volumes being 12% lower. Therefore, the orthopaedic waiting list still increased 7.8% in January 2024 year-on-year.
Of the two biggest specialities in private hospitals, NHS-paid ophthalmology activity tripled between 2019 to 2023 but orthopaedic grew only 14%. NHS-paid but privately delivered ophthalmology is now larger by activity (in comparison, privately-paid orthopaedic activity is still twice as large for private providers). As a result, the waiting list for eye treatments in January 2024 dropped by 1.5% year-on-year as numerous specialist clinics – including Optegra, SpaMedica, Newmedica and Community Health and Eyecare (CHEC) benefitted from increased NHS work. However, privately-paid ophthalmology volumes dropped 4% from 2022 to 2023 in PHIN data (as compared to a 6% increase in orthopaedics).
Private providers continue to do well but could do even better.
Most providers report feeling very optimistic in the latest Independent Healthcare Provider Network Industry Barometer.
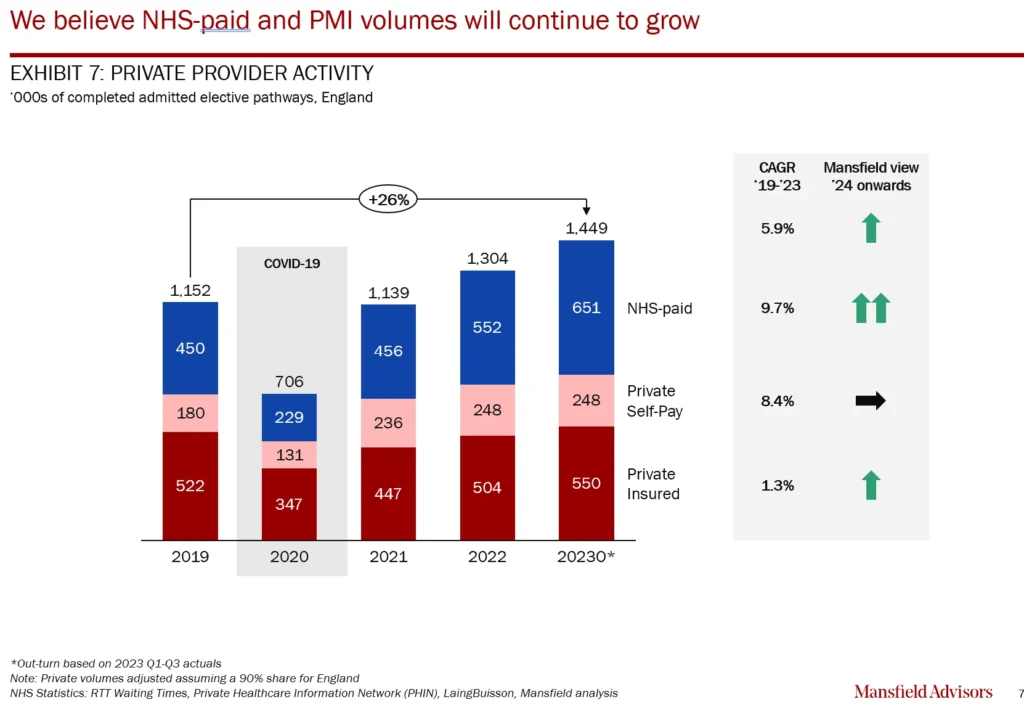
The private sector has seen strong growth in self-pay patients post-pandemic. But self-pay volumes seem to have peaked. The pandemic’s aftermath was a perfect storm as everyone knew the NHS provision was scarce, waiting lists were increasing and private hospitals had much improved their packages and marketing. We are optimistic enough to believe this is the new normal level of demand. More price-competitive offerings from Ramsay and Practice Plus Group are also helping to sustain this segment.
The demand for PMI-paid treatment has returned to pre-pandemic levels but should see some further growth with a lag, as PMI coverage itself has grown. Penetration is increasing again after a long period of relative stagnation. In 2023, Benenden Health reported a doubling in memberships, with a 36% increase in service usage. Benenden serves a younger customer base and greater penetration within that segment is a promising development.
We reiterate our recommendation, to a possibly imminent Labour Government, that it use its budget to spend directly in the private sector to draw down the waiting lists for procedures. We continue to argue that the capacity certainly exists, and this is the most cost-effective way to achieve greater outputs in elective surgery. We would argue that there is ultimately no desire even in New Labour’s heyday to see elective waiting times drop below 12-14 weeks or private demand would decrease correspondingly. However, even if that is the politically acceptable waiting time for public treatment, we are still a long way from that and there is plenty of scope for improvement!
Only once the elective waiting lists are under control, will there much appetite to decrease waiting times for consultations and scan, which will happen naturally once waiting lists for procedures are lower.
The next question we have is whether there will ever be an effective plan implemented to fix chronic diagnostic under-capacity. This will be one of our next topics to look at in more detail.