


Cattle Feed Demand to 2040: From Herd Growth, Feed and Investment

Executive message: cattle feed demand to 2040
Global cattle farming — and with it cattle feed demand — is changing fast. The world will keep more cattle by 2040, but not in the same places and not in the same way. On a simple trend based on FAOSTAT data, the global herd grows from 1.58 billion head in 2024 to about 1.73 billion by 2040. That is 151 million more cattle, or about +9.6%. The headline is not ‘more cattle everywhere’. It is more cattle in a few growing regions, tighter herds in mature markets, and stronger pressure everywhere to get more value from each animal.
This raises a simple question for investors and suppliers: does a bigger herd mean more feed, and does better farming raise the amount of feed used per animal? This note brings the headcount view together with a feed-demand model to answer it.
The short answer is that feed demand is likely to grow faster than cattle numbers. More animals add some demand. But the bigger opportunity comes from intensification: more commercial feeding, lower emissions per animal, better rations, mineral and vitamin supplements, feedlots, commercial dairy, and higher per-animal feed spending.
The one-line takeaway for investors and suppliers
Headcount is the weaker signal (about +10% worldwide). The stronger, more bankable signal is intensification: the shift to feedlots, commercial dairy and better rations. This lifts spending on feed, genetics, health and data per animal, mainly in Africa, South Asia and parts of Latin America.
Two views of the same herd: headcount and cattle feed demand
We use two simple models. They look at the same animals in different ways, so it helps to be clear about what each one can and cannot say.
The headcount view (how many cattle). We fit a straight-line trend to FAOSTAT cattle numbers for 2000–2024 and extend it to 2040. It is simple and cautious. It answers one question: where will there be more or fewer cattle? This gives the +9.6% figure and the regional map below.
The feed view (how much feed). A separate model estimates demand for beef, works out the herd that fits that demand, and multiplies it by an illustrative global average assumption 6.5 tonnes dry matter intake per head per year, including forage, grazing and purchased feed. It answers a different question: how much feed might the herd eat?
What changes by 2040: the global cattle herd map
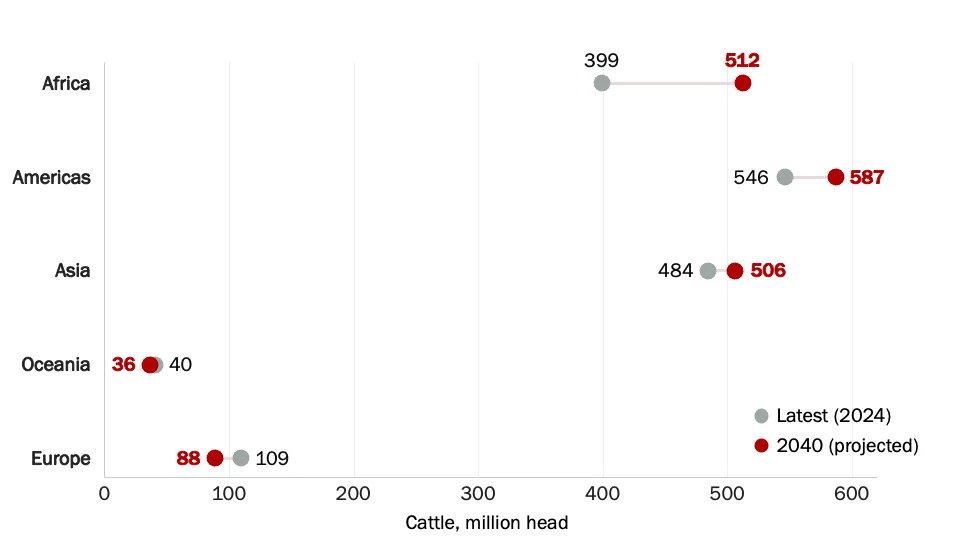
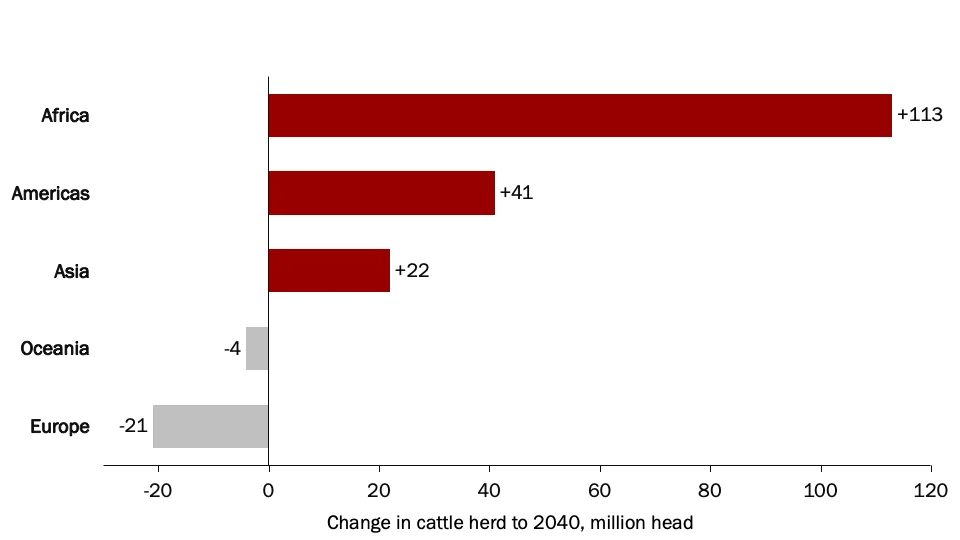
Africa is the growth story. The herd rises from 399 to 512 million head. That is 113 million more cattle, about three-quarters of the whole world’s increase. Eastern Africa adds about 76 million, Western Africa about 30 million, and Middle Africa about 18 million. This is a large opportunity, but not an easy one. More cattle do not automatically mean profitable, lasting farms. The value lies in feed supply, mineral and vitamin supplements, better breeding, animals suited to heat and disease, vet services, cold chains and market access.
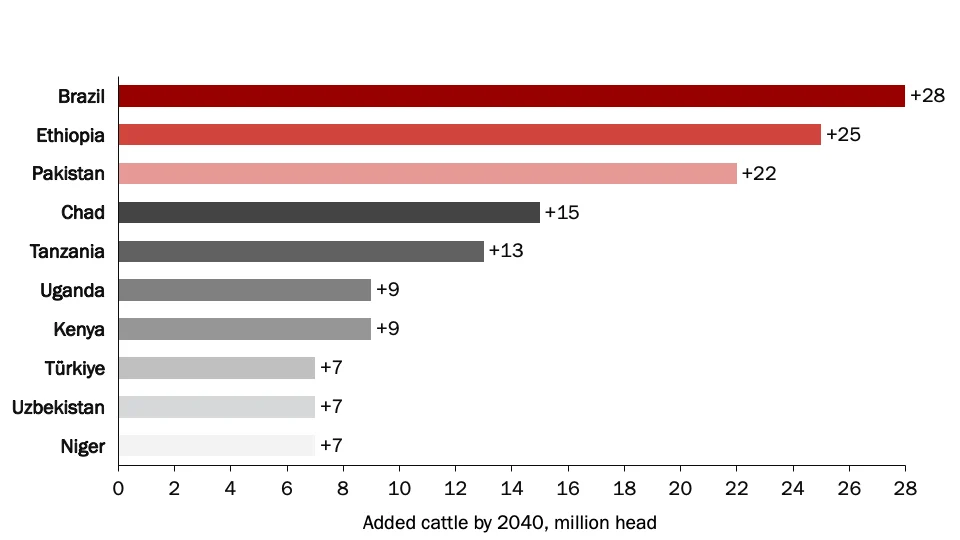
The Americas remain the largest base (546 to 587 million head). Most of the extra volume is in South America, especially Brazil. Brazil is already the biggest single market and should add about 28 million head. It is both a large market and a place where sustainability matters: traceability, deforestation-free supply, and pasture management and methane control will determine where investment pays off.
Asia is mixed (484 to 506 million head). Southern Asia grows, led by Pakistan, while Eastern Asia shrinks, led by the fall in China. Europe and Oceania shrink (Europe 109 to 88 million; Oceania 40 to 36 million). They stay attractive for output per animal, lower emissions, animal welfare and compliance, rather than for volume.
Figure 1 · Regional cattle outlook to 2040
Source: FAOSTAT
Table 1 · Regional cattle outlook to 2040
| Region | Latest (m head) | 2040 (m head) | Change (m head) | % change | Direction |
|---|---|---|---|---|---|
| Africa | 399 | 512 | +113 | +28.4% | Growing |
| Americas | 546 | 587 | +41 | +7.4% | Growing |
| Asia | 484 | 506 | +22 | +4.6% | Stable |
| Oceania | 40 | 36 | -4 | -10.2% | Stable |
| Europe | 109 | 88 | -21 | -19.1% | Declining |
| World | 1,578 | 1,729 | +151 | +9.6% | Growing |
Source: FAOSTAT-based linear-trend projection (2000–2024 fitted, extended to 2040). Figures rounded.
Figure 2 · Where the cattle herd grows and shrinks by 2040
Source: FAOSTAT
Table 2 · Largest country herd increases to 2040
| Country | Latest (m head) | 2040 (m head) | Change (m head) | % change |
|---|---|---|---|---|
| Brazil | 238 | 267 | +28 | +11.9% |
| Ethiopia | 72 | 97 | +25 | +35.3% |
| Pakistan | 58 | 80 | +22 | +39.0% |
| Chad | 40 | 55 | +15 | +38.4% |
| Tanzania | 39 | 52 | +13 | +33.9% |
| Kenya | 22 | 32 | +9 | +41.8% |
| Uganda | 15 | 24 | +9 | +61.9% |
| Niger | 20 | 28 | +7 | +36.4% |
| Uzbekistan | 14 | 22 | +7 | +51.7% |
| Turkey | 17 | 24 | +7 | +42.0% |
Source: FAOSTAT-based projection. Africa and South/Central Asia lead the absolute gains.
Figure 3 · Top ten countries by cattle added to 2040 (million head)
Source: FAOSTAT
The largest falls are in China, Russia, Australia, Iran, Canada and Ukraine, among others. These are not simple ‘avoid’ signals. Markets with flat or falling numbers can still want technology that raises output per animal.
Will cattle feed demand grow faster than the herd?
Feed demand depends on two things, not one:
Estimating Feed Demand
Feed demand = number of cattle × feed used per animal
The feed demand model keeps the second part fixed at 6.5 tonnes per animal. That is a fair starting point, but it has one clear effect: if feed per animal does not change, feed demand grows at exactly the same rate as the herd. So, the model on its own cannot tell us whether feed grows faster or slower than cattle numbers. It has assumed the answer is ‘the same’.
Better farming and wider access to commercial systems push on the very part the model holds still: feed per animal. This is the intensity effect, and it holds most of the commercial value. Adding even a small rise in feed per animal changes the picture a lot.
Table 3 · Illustrative feed-demand scenarios to 2040
| Scenario | Herd Growth | Feed/head change | Feed demand 2040 | Total feed growth |
|---|---|---|---|---|
| Headcount only (model as built) | +9.6% | 0% (held at 6.50 t) | ≈ 11,245 Mt DM | +9.6% |
| + modest intensification | +9.6% | +10% (7.15 t) | ≈ 12,370 Mt DM | +20.4% |
| + stronger intensification | +9.6% | +20% (7.60 t) | ≈ 13,494 Mt DM | +31.4% |
Illustrative, on the credible herd path (1.58 → 1.73 bn head). Feed-per-head changes are scenario assumptions, not model outputs. Mt DM = million tonnes of dry-matter feed.
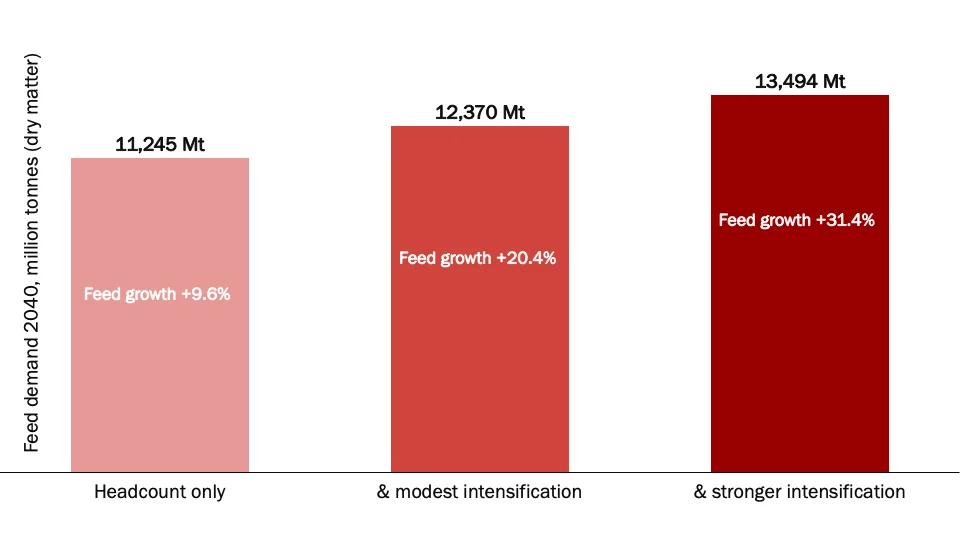
Figure 4 · Feed demand in 2040 under three intensification scenarios (million tonnes, dry matter)
Source: FAOSTAT
Faster
On the credible herd path, cattle numbers grow about +10%. But feed demand could grow two to three times faster if commercial feeding and better rations keep spreading. The growth in feed is mainly an intensity story, not a headcount story.
Where cattle feed demand concentrates
The herd-growth tables, together with the intensity logic, point to a clear map of future feed-demand growth.
- Sub-Saharan Africa is the volume frontier. Ethiopia, Tanzania, Kenya, Uganda, Chad and Niger combine more cattle with more commercial feeding, so both parts of the feed equation push the same way.
- South Asia is a demand engine. Pakistan and India show strong feed-demand growth, driven by demand for meat and dairy rather than simple headcount.
- Brazil and the United States anchor the volume. Small growth rates on very large herds still move large tonnages, especially as Brazilian finishing grows.
- The EU, Australia and Japan are flat or falling. Here the feed opportunity is precision nutrition and efficiency per animal, not tonnage.
The 2040 cattle investment map
Cattle investment to 2040 should not be built around headcount alone. We see four market types and four investment pillars.
Four cattle market types
- Scale-growth markets (Africa, South/Central Asia, parts of Latin America): infrastructure, health systems, feed, genetics and the tools that turn more cattle into more output.
- Productivity markets: stable or modest herd growth, but rising demand for output and feed efficiency per animal.
- Contraction markets (Europe, Oceania): efficiency, welfare, lower emissions and premium positioning.
- Higher-risk markets: disease surveillance, vaccine security, climate resilience and risk controls that banks can finance.
Four cattle investment pillars
- Feed and nutrition, now the lead pillar. The strongest case is not selling more tonnes. It is ration design, better forage, use of by-products, mineral, vitamin and mould-toxin (mycotoxin) management, and advice that turns feed into more milk, meat, fertility and resilience.
- Genetics and reproduction. Growth markets need animals that do well under local heat and disease. Mature markets need genetics for lower emissions and less labour.
- Animal health and vaccines. Bigger, more connected herds make prevention more valuable. Foot-and-mouth disease (FMD) is the clearest example: it is a trade and market-access risk, not only a farm disease. Recent concern over the FMDV SAT1 strain adds to the need for surveillance, vaccine matching and regional coordination. The opportunity is bundled prevention: diagnostics, vaccine supply, cold chain, biosecurity and data.
- Digital livestock infrastructure. Animal ID, movement records, feed and output monitoring, disease reporting and finance-linked performance data: the links between farms, processors, insurers, banks, vets and regulators.
What this means for cattle and livestock investment
By region
- Africa (volume-led growth): back feed systems, vet infrastructure and digital herd services. Add tropical genetics, fertility management and disease control programmes.
- Europe and Oceania (efficiency): focus on value per animal, not volume, through precision nutrition, sustainability reporting, surveillance and high-performance breeding.
- The Americas (scale): stay engaged because of sheer size and Brazil’s continued growth.
- Asia (country by country): expand in markets like Pakistan and Central Asia, and treat falling markets like China as efficiency targets.
By sector
- Feed producers: offer regionally suited rations and feed-efficiency services, with forage improvement, by-product use and mycotoxin management.
- Animal-health companies: invest in vaccine logistics, diagnostics and surveillance systems.
- Investors: avoid selling single products in isolation. Build platforms that join genetics, nutrition, health and data.
A note on the FAOSTAT cattle data
Read these as signals, not forecasts
Both models come from public FAOSTAT data and simple trends. The straight-line model is easy to explain, but it can be pushed too far: a few small markets fall to zero, which may not be realistic. We use a reliability score (R²) only as a rough guide, not as a full confidence test. Treat the feed-demand numbers as market-sizing signals, not exact country forecasts.
How Mansfield can help
Mansfield Advisors advises feed, genetics, animal-health and veterinary businesses, and the investors backing them, on where value sits as the cattle market intensifies: market sizing, entry strategy, commercial due diligence and growth planning.
To discuss what these projections mean for your business, contact the authors at Mansfield Advisors. More detail covering our experience and insights can be found on our vets, pets and livestock sector page.


